")
")
")
")
")
")
")
")
")
")
")
Dow drops 1,100 points, continues fastest 10% drop in history
With CNBC’s Brian Sullivan and the Fast Money traders, Tim Seymour, RBC’s Lori Calvasina, Dan Nathan and Steve Grasso.
Michael Kantrowitz, Cornerstone Macro, looks ahead to what could happen in the markets tomorrow.
The U.S. stock market fell into a correction Thursday as investors punished equities in favor of safer assets as anxiety over the spread and potential impact of the virulent coronavirus.
A correction is defined as a 10% decline in one of the major U.S. stock indexes, typically the S&P 500 or Dow Jones Industrial Average, from a recent 52-week high close.
Historical analysis shows these corrections result in a 13% decline and take about four months to recover to prior levels, on average.
But there’s one big caveat. This is only if it does not fall into bear market territory, down 20% from a high. If the losses stretch to 20%, then there’s more pain ahead and a longer recovery time.
Here are the numbers, according to CNBC and Goldman Sachs analysis:
There have been 26 market corrections (not including Thursday) since World War II with an average decline of 13.7% over an average of four months.
Recoveries have taken four months on average.
The most recent corrections occurred from September 2018 to December 2018. The S&P 500 bounced into and out of correction throughout the autumn of 2018 before plunging into a bear market (a 20% decline from its all-time high) on Christmas Eve.
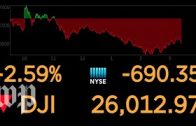
The Dow and the S&P 500 each fell 4.4% on Thursday — the Dow lost a record 1,190.9 points — and each closed well in correction territory based on their recent record close. The S&P 500 and Dow are each down more than 10% since Monday and more than 12% each since their respective all-time intraday and closing highs hit earlier in February.
The S&P 500′s close below 3,047.53 — its current threshold for a correction — also marked the quickest 10% decline from an all-time high in the index’s history, according to Bespoke Investment Group.
There have been 12 bear markets since World War II with an average decline of 32.5% as measured on a close-to-close basis.
The most recent was October 2007 to March 2009, when the market dropped 57% and then took more than four years to recover. The S&P 500 closed in a bear market in December 2018 using intraday data.
Bear markets have lasted 14.5 months on average and have taken two years to recover on average.
For access to live and exclusive video from CNBC subscribe to CNBC PRO: https://www.cnbc.com/pro/?__source=youtube
» Subscribe to CNBC TV: https://cnb.cx/SubscribeCNBCtelevision
» Subscribe to CNBC: https://cnb.cx/SubscribeCNBC
» Subscribe to CNBC Classic: https://cnb.cx/SubscribeCNBCclassic
Turn to CNBC TV for the latest stock market news and analysis. From market futures to live price updates CNBC is the leader in business news worldwide.
Connect with CNBC News Online
Get the latest news: http://www.cnbc.com/
Follow CNBC on LinkedIn: https://cnb.cx/LinkedInCNBC
Follow CNBC News on Facebook: https://cnb.cx/LikeCNBC
Follow CNBC News on Twitter: https://cnb.cx/FollowCNBC
Follow CNBC News on Instagram: https://cnb.cx/InstagramCNBC
#CNBC
#CNBC TV